Interactive Installations
Real-Time Data Wall
Interactive Installations concept for institutional showcases, conferences
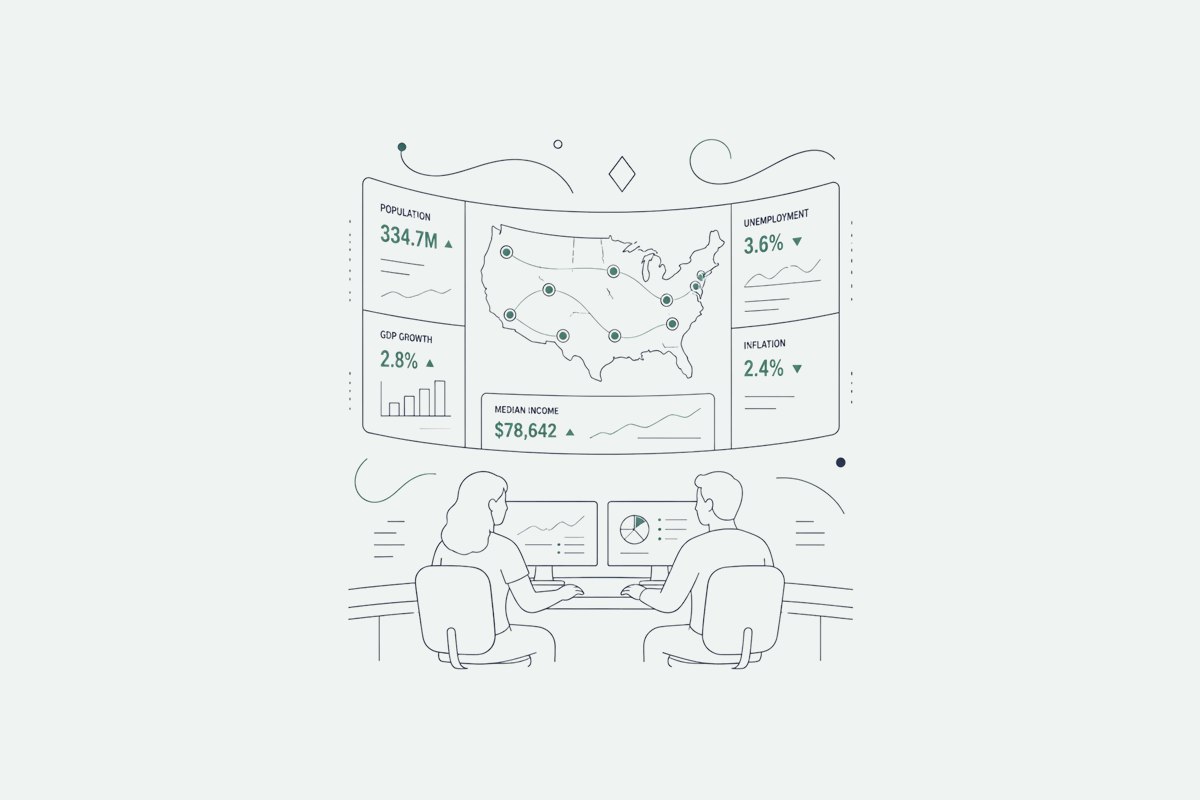
A large-format command-style display presents live or periodically refreshed counters, maps, milestones and approved data feeds.
Concept stage · Available for custom development
Institutional showcases · Conferences · Command centres
 View full image ↗
Illustrative proposal visual. This idea has not been delivered as a project.
The experience
How guests take part
The wall combines national or organizational metrics with animated geography, achievement tickers and timeline content. Data can come from APIs or a controlled manual update workflow.
- 01
Display the headline metrics
- 02
Animate geography and milestones
- 03
Refresh from approved live or manual data sources
The intended outcomeScale, progress and operational impact are visible at a glance for visitors, media and leadership audiences.
Plan your event
Make it work for your brief
Customization options
- Metric hierarchy and visual language
- Maps, counters and ticker modules
- API or moderated data inputs
Setup requirements
- LED wall or multi-screen canvas
- Approved data sources
- Reliable network or local fallback
Final production scope and technical feasibility are confirmed against your event brief.
Good to know
Planning questions
Can this idea be customized?
Yes. The content, interface, branding, physical format and output journey can be developed for the audience, venue, schedule and technical scope of a new event.
What is needed to develop this concept?
A confirmed objective, audience, venue, event date and production brief are the starting point. Technical feasibility, content approvals, fabrication, staffing and testing are defined during development.
Let’s talk
Develop this idea for your event
Tell us your event date, venue and expected guest count.